the
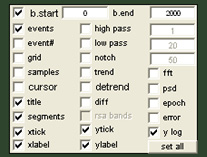
'set all / set one' - button
the
caption of this button denotes the way changes in display options are
applied: to all signals or to only the currently active signal. Pushing
this button will toggle the apply-state from 'set al' to 'set one' and
back.
the
baseline checkbox and it's
'b.start'- and 'b.end' edit fields (ANS data files only)
the checkbox enables/disables the calculation of a baseline, the
b.start and b.end fields specify the begin- and endtime of the baseline
calculation, measured in milliseconds from the beginning of the file.
the
'segments'-checkbox
this options decides wether segments defined with 'find peak' or
'redefine segments' are displayed as transparent blue surfaces.
the 'events'-checkbox
activates/deactivates
drawing of markers on raw signals at locations of event samples (available for raw signals only)
the 'event#'-checkbox
activates/deactivates numbering of event markers (available for raw signals only)
the 'samples'-checkbox
activates/deactivates highlighting
sample points with a small circle
the 'cursor'-checkbox
activates/deactivates
drawing of a blue cursor line at the cursor time (if fixed,
in the middle of the displayed window).
the 'title'-checkbox
activates/deactivates display of the signal title
the
'grid'-checkbox
activates/deactivates display of a
grid background in the axis
the 'high
pass'-checkbox
activates/deactivates a high pass
filter, that is applied to the data just before display (the stored
signal is not changed, only the displayed waveform)
the 'low
pass'-checkbox
activates/deactivates a low pass
filter, that is applied to the data just before display (the stored
signal is not changed, only the displayed waveform)
the
'differentiation'-checkbox
activates/deactivates displaying the
signal as difference-scores between adjacent elements (available for
event signals only)
the
'notch'-checkbox
activates/deactivates a notch
filter, that is applied to the data just before display (the stored
signal is not changed, only the displayed waveform) (available for raw signals only)
the
'xtick'-checkbox
activates/deactivates display of
xtick marks and xtick labels on the axis
the
'ytick'-checkbox
activates/deactivates display of
ytick marks and ytick labels on the axis
the
'xlabel'-checkbox
activates/deactivates display of an
x-axis-title
the
'ylabel'-checkbox
activates/deactivates display of an
y-axis-title
the
'fft'-checkbox
activates/deactivates display of the
power frequency spectrum of the signal .
the
'psd'-checkbox
activates/deactivates display of the
power spectral density of the signal.
the
'rsa-bands'-checkbox
activates/deactivates coloured
display of low, middle and high frequency bands related to respiratory
sinus arrhythmia.
the
'trend'-checkbox
activates/deactivates display of a
general trend in the data
the
'detrend'-checkbox
activates/deactivates subtraction of
the displayed trend from the data